

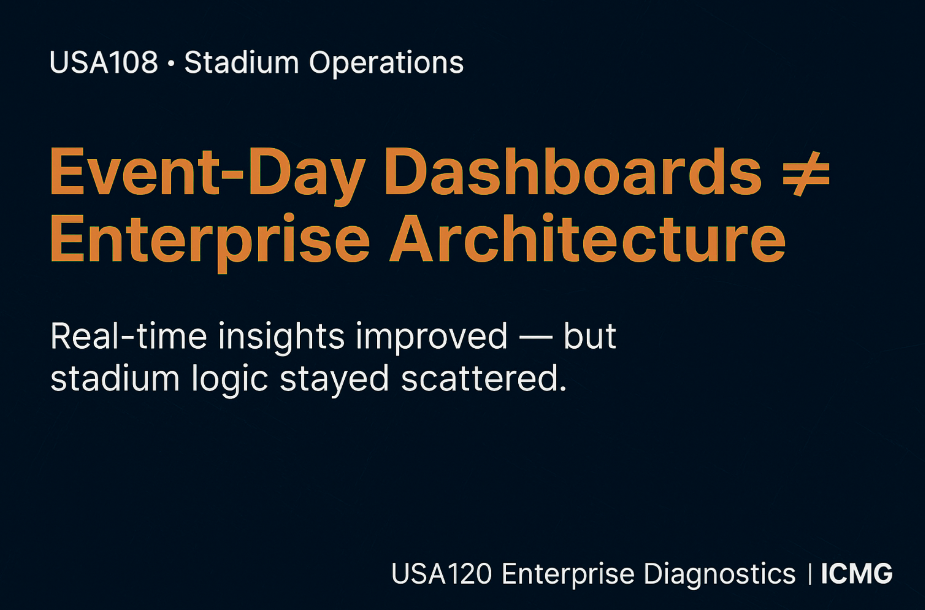
Case USA108: How a Stadium Operations Team Replaced Enterprise Architecture with Event-Day Dashboards
- Sunil Dutt Jha

- Aug 11, 2025
- 2 min read
Updated: Nov 3, 2025
Overview:
This case is part of a 120-diagnostic series revealing how major sports and entertainment venues have mislabeled operational monitoring as “Enterprise Architecture progress.”
In stadium management, a recurring pattern is treating real-time event-day dashboards as proof of architectural maturity.
Management could view gate entry counts, concession sales, and staffing levels in real time — yet the enterprise structure linking ticketing, security, concessions, facility management, and partner coordination was never modeled.
P1–P6 Insight Preview: These six perspectives define how an enterprise connects intent to execution — P1: Strategy, P2: Business Processes, P3: System Behaviors, P4: Component Governance, P5: Implementation, P6: Business & Technology Operations.
P1 (Strategy): Dashboards were promoted as a fan experience innovation, but no architecture-led roadmap tied them to revenue optimization, safety, or operational resilience.
P2 (Process): Event-day workflows for sales and staffing were visible, but coordination for emergency response, partner services, and facility upkeep remained siloed.
P3 (System): Dashboards weren’t behaviorally integrated with ticketing systems, security feeds, or point-of-sale platforms.
P4 (Component): Access control, POS, security, and facility systems were governed separately, causing rule conflicts and data mismatches.
P5 (Implementation): Rollouts focused on visualizations for executives, deferring deep process and integration redesign.
P6 (Operations): Business ops could monitor KPIs in real time, but tech ops manually reconciled data and triggered actions during events.
Stakeholder Impact Summary:
CEO/Stadium General Manager – accountable for event success and profitability: Limited by weak P1 Strategy — visibility improves decisions in the moment but doesn’t address systemic inefficiencies.
CIO – responsible for venue technology and integration: Impacted by P3 System Behaviors and P4 Component Governance — systems don’t operate on shared data or policies.
Sales Head (Sponsorship & Premium Sales) – manages sponsor visibility and premium services: Affected by P2 Processes and P5 Implementation — can promise exposure but can’t coordinate flawless delivery across departments.
Chief Enterprise Architect – ensures venue operations and technology support strategic goals: Confronts P1–P6 issues — dashboards monitor activity without orchestrating the enterprise.
Want to read more?
Subscribe to architecturerating.com to keep reading this exclusive post.


